Skip to content
FacebookTwitterYouTube
Welcome to the National Coalition for Safer Roads Website Logo Welcome to the National Coalition for Safer Roads Website Logo
  • About
  • National Safety Weeks
    • School Bus Safety Week
      • National School Bus Safety Week 2023
      • National School Bus Safety Week 2022
      • National School Bus Safety Week 2021
    • Stop on Red Week
      • Stop On Red Week 2023
      • Stop On Red Week 2022
      • Stop On Red Week 2021
      • Stop On Red Week 2020
      • Stop on Red Week 2019
        • Red-Light Running Fatality Map 2019
      • Stop on Red Week 2018
        • Red-Light Running Fatality Map
      • Stop on Red 2017
      • Stop on Red 2016
  • Key Issues
    • AUTOMATED ENFORCEMENT CHECKLIST
    • LEGISLATIVE RESOURCES
    • RED-LIGHT SAFETY
    • SCHOOL BUS STOP ARM SAFETY
    • SPEED SAFETY
  • Testimonials
    • AMANDA DEVINE
    • LORI KOIDAHL
    • MELISSA WANDALL
    • The Miami Project
    • Tom and Lauren Hanley
  • Q&A
  • News
  • Partners
  • Contact

SPEED SAFETY

SPEED SAFETYhmcdonald2020-09-23T17:05:32-04:00

AT A GLANCE

  • In 2018, speeding killed an estimated 9,378 people across the country, which is 26 percent of total traffic fatalities for the year. (NHTSA).The United States loses $52 billion annually due to speeding-related fatality collisions (NHTSA).
  • A pedestrian struck by a car at 20 miles per hour has a 95 percent chance of survival, but the survival rate drops to 60 percent at 30 miles per hour and 20 percent at 40 miles per hour (Safe Kids Worldwide).
  • Fixed speed cameras reduce injury crashes by 20 to 25 percent (NHTSA).
  • Mobile speed cameras reduce injury collisions by 21 to 51 percent (NHTSA).

THE BIG PICTURE

Speeding is both costly and incredibly dangerous. In 2018, there were 51,490 drivers involved in 33,654 fatal crashes, in which 36,560 people lost their lives. Seventeen percent of the drivers involved were speeding at the time of the crashes, and 26 percent of those killed were in crashes each involving at least one speeding driver.

Speeding also makes already dangerous collisions more deadly. A pedestrian struck by a car at 20 miles per hour has a 95 percent chance of survival, but the survival rate drops to 60 percent at 30 miles per hour and 20 percent at 40 miles per hour.

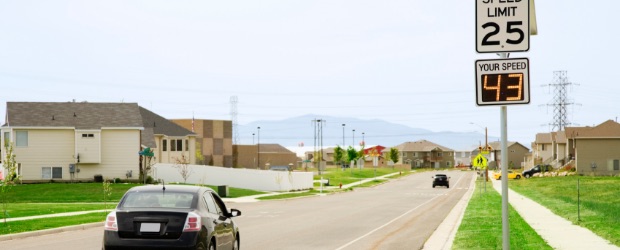
Speed safety cameras are incredibly effective at reducing driver speeds and keeping people safe. The National Highway Traffic Safety Administration reports that fixed speed cameras reduce injury crashes by 20 to 25 percent and mobile speed cameras reduce injury collisions by 21 to 51 percent.

Additionally, camera technology helps to reduce speeds in particularly vulnerable areas like school zones. For example, only 10 percent of drivers in Oregon school zones with speed safety cameras and flashing signage exceeded the 20 mile-per-hour speed limit by more than five miles per hour. In Oregon school zones without these safety precautions, 56 percent of drivers exceeded the speed limit by the same amount.

Copyright 2017-2023 NCSR. All Rights Reserved | Privacy Policy | Sign Up for Updates | Contact Us
FacebookTwitterYouTube
Page load link
Go to Top